Undertaking a cost-effective PSA
For many industries, the consequences of an accident are relatively low and can be assessed using simple, deterministic rules. An example is the general office environment. However, such an approach would not be suitable for more complex facilities where the potential consequences of an accident are high, for example, nuclear power stations, oil refineries and railways.
In these instances, the risk can be quantified using a number of standard techniques described as Probabilistic Safety Assessment (PSA), Probabilistic Risk Analysis (PRA) or Quantitative Risk Assessment (QRA).
REQUIREMENTS CAPTURE
PSA (or PRA or QRA) is usually justified where there is:
- major personnel or environmental hazard potential, or
- significant economic implications, or
- a variety of risk trade-off decisions that need to be made
In these cases, the issue is not one of whether, but rather how, one should quantify the risk. Inadequate thought before commissioning a PSA can lead to an assessment that involves significant expense, late delivery and a failure to address the real risks. The key to providing a cost-effective and timely PSA is to have a clear understanding of:
- The risk criteria against which the results of the PSA are to be compared
- The level and depth of required risk assessment, which should be commensurate with the complexity and the perceived level of risk of the facility/operation.
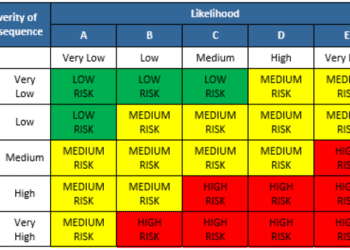
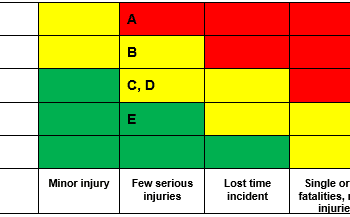
For many low risk/ low consequence facilities or operations, a simple, deterministic Risk Matrix is likely to prove adequate (see RISKworld issue 1).
This type of approach does have its limitations, especially for complex facilities involving, for example, a high degree of redundancy and diversity within the design. In these circumstances, a comprehensive risk model of the facility can be developed using a number of accepted methods, including:
- Event trees – a graphical representation of a logic model that identifies and quantifies the effectiveness of the operator and safety systems to prevent unacceptable consequences (e.g. loss of life) that would otherwise occur following an initial event (see figure 1).
- Fault trees – a graphical representation of a logic model that identifies and quantifies combinations of failures that may result in a pre-defined, unwanted “top event” (see figure 2).
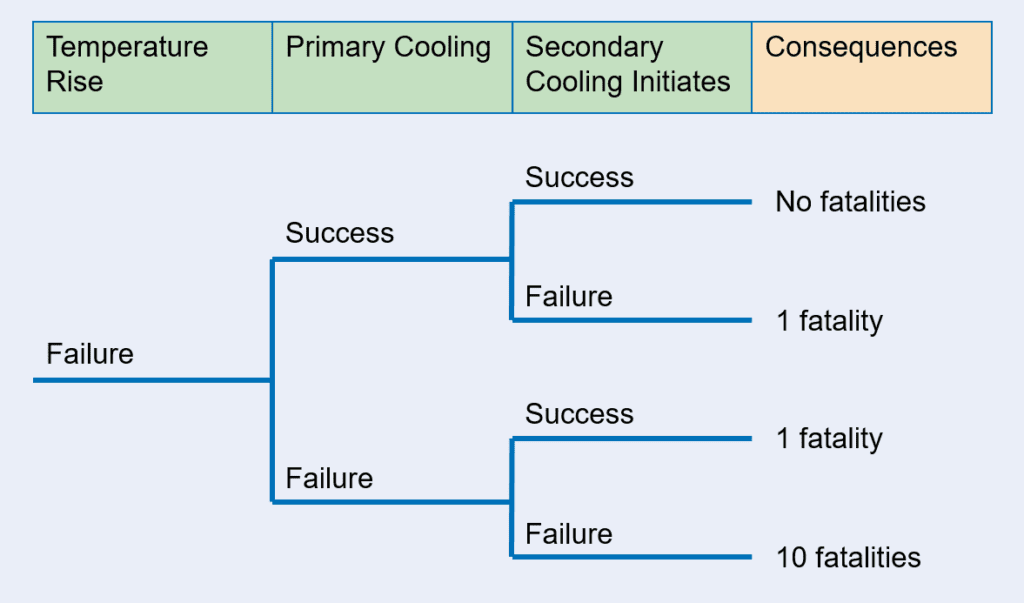
Figure 1
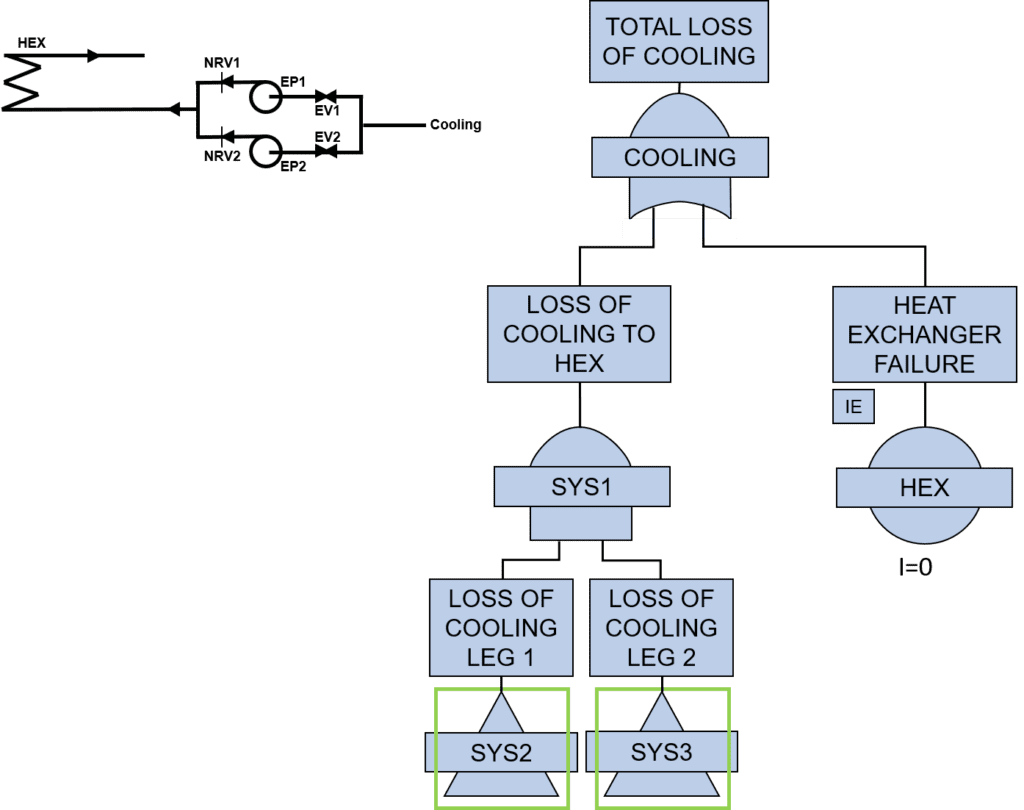
Figure 2
RISK MODELLING
These two complementary approaches can be used separately or, if the stakeholders’ objectives so require, as part of an integrated and detailed model of a facility. In both instances, the interactions between normally operating systems, the operator, safety systems and emergency procedures must be captured to ensure that the resulting model represents a true reflection of the facility.
In either case, the development of such a comprehensive risk model can be expensive and will involve significant effort from the stakeholders’ own organisations to ensure that the model does adequately embody the actual design and real operating practices.
THE BENEFITS
A PSA can, if developed appropriately, be used to immense benefit, e.g.
- Demonstrating that the risks associated with normal, abnormal and fault conditions comply with the relevant safety criteria and are tolerable
- Identifying, ranking and correcting weaknesses within the design and operation at all stages in the life cycle
- Comparing the relative merits of potential modifications or improvements and in supporting the demonstration that the risks are ALARP
- Aiding in the development of test, repair and maintenance strategies that balance the cost with the safety benefit
- Assisting the operator in the detailed planning of influential activities
- Identifying the optimum strategy to minimise risk following an equipment fault – for example, by supporting the concept of a real-time “risk monitor”
The skill in developing a cost-effective PSA is not in the construction of the risk models but in the process by which the real needs of the stakeholders are identified and matched against the tools and data available, and the level of modelling.
This article first appeared in RISKworld Issue 3.