Ship collision risk assessment – turning data into realism
Ship collisions can result in substantial damage to offshore assets and be a major contributor to the risks of personnel onboard. With the growing availability of historical ship location data, comes the ability to provide bespoke predictions of ship collision risk and target specific risk reduction measures.
INTRODUCTION
Collision risk is often assessed using available information such as published accident statistics and shipping densities. Accident frequencies typically relate to broad operating regions, e.g. UK continental shelf, and whilst shipping densities may be more location specific, they can still cover relatively large patches of sea and provide little information regarding the nature of vessels. Given the coarse geographical resolution of such information, the question for operators is whether such data are representative of their specific circumstances and, by extension, whether it can be used to provide meaningful conclusions.
LOCATION, LOCATION
The details of historical shipping traffic around a location of interest can significantly improve any analysis of collision risk. Such information is widely available from vessel tracking service providers, based on collated transmissions from the Automatic Identification System (AIS) used by most vessels.
AIS is a system designed to automatically provide information about a ship to other ships and to coastal stations. It is required to be fitted on all ships on international voyages of 300 gross tonnage (gt) or more, cargo ships of 500 gt or more and all passenger ships irrespective of size. The system is also routinely used by smaller vessels to help reduce collision risks. Each AIS transmission provides the position, speed, course and heading of the vessel, and static information such as identification (e.g. call sign, name, IMO number), length, beam and vessel type. An AIS data set can therefore provide a wealth of information regarding the historical vessel traffic around an installation.
DATA MINING
The number of signals in the data set depends on the vessel activity in the region, and also on the spatial extent, time period and sampling time in the data (i.e. time between AIS signals from the same vessel), but it is not unusual for there to be several million records to analyse. For relatively large data sets like this, the use of a database package and associated query language (e.g. SQL) is essential for storage, rapid interrogation and processing of data.
Most risk assessment models for vessel collision consider contributions from passing vessels in nearby shipping lanes that could potentially steer or drift off course onto a collision course, as well as the hazards from fishing boats in the local area and planned visits by vessels attending the installation. The AIS data can be used in a number of diverse ways to highlight and define the risks presented by each of these contributions.
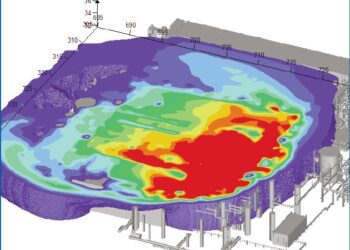
A simple analysis of the positional data associated with each signal allows vessel densities to be visualised (Figure 1). This can immediately identify key routes or lanes close to the installation, e.g. the orange straight lines running top to bottom in Figure 1. Further interrogation of shipping lane data can quickly determine the number of vessels and the distribution of vessel types, speeds, energies, sizes, transit times and closest points of approach for vessels in a particular lane. Such analysis can be directly applied to collision models of passing traffic, noting that it reflects actual operations in the area.
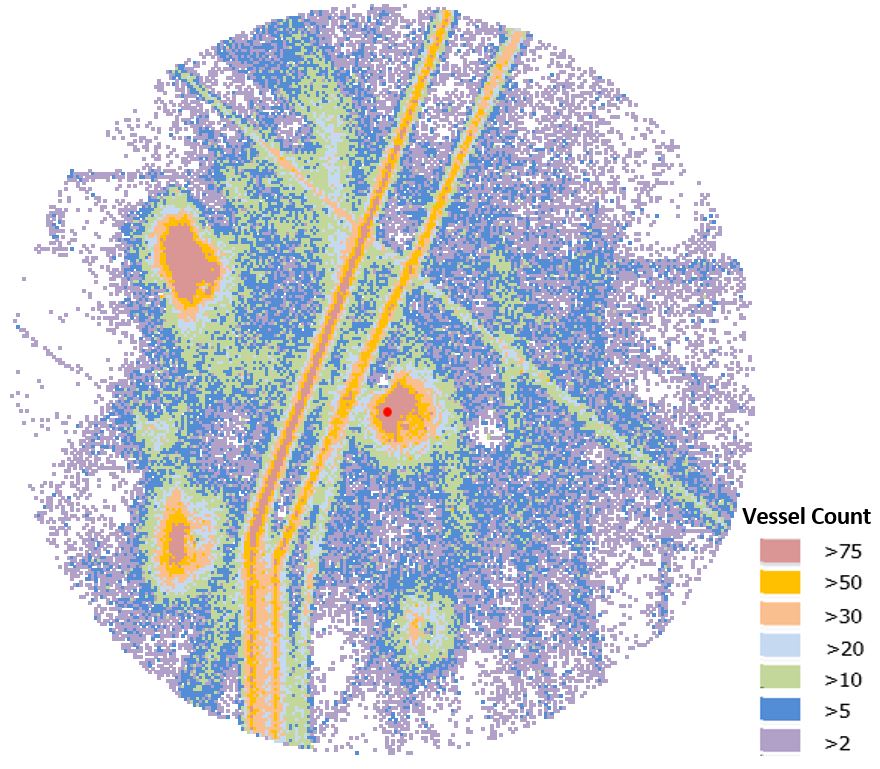
Figure 1 – Example AIS vessel density plot around an offshore installation (red dot at the centre)
Fishing vessels do not follow such predictable courses, but understanding the local fishing vessel density and potential impact energies can allow generic accident frequencies to be calibrated appropriately. The types of gear and engine sizes of fishing vessels can also be determined by cross-referencing identified vessels against local fishing fleet registry information. This can be particularly relevant to subsea infrastructure, with the potential for damage by snagging of nets and trawling board impacts.
BIG BROTHER…
It is common for operators to implement strict vessel management procedures for vessels visiting an installation (e.g. supply vessels, offloading tankers), with only authorised vessels allowed to approach closer than 500m and with significant speed restrictions. Using historical AIS data, it is straightforward to identify all incursions into the restricted zone as well as the particular vessels and speeds. Such information not only provides actual incursion and speed statistics for use in the risk assessment, but also provides a check that in-field procedures are being followed appropriately. Where such restrictions are violated, procedures can be reviewed and improved.
CONCLUSION
Ship collision poses a severe hazard to offshore installations and the associated risks should be assessed carefully. Historical vessel movement data from AIS transmissions provide a means to analyse vessel movements in the immediate region around a facility and can provide a rich insight into the nature of the traffic. This allows for an improved assessment of collision risks for an installation compared with the traditional use of generic data, and allows more specific risk reduction measures to be identified.
This article first appeared in RISKworld issue 32.